The macroeconomic activity of 2021 and 2022 took us on quite a ride after the pandemic. First we saw massive injections of liquidity accompanied by plunging interest rates. This was followed by spiking interest rates, high inflation, and price volatility. And now we find ourselves in a period of price correction in the commercial real estate (“CRE”) market. Considering the amount of price volatility and the subsequent price correction from its peak that ensued, it seems logical to ask the question, “Do CRE prices in 2023 offer value relative to long-term historical trends?” While focusing on pricing alone can be myopic, as many factors go into CRE valuations, it’s fair to wonder if the price declines of 2022 present real value in 2023 or, if it merely offers a mark down from the valuation spikes of 2021, especially for assets where prices soared upwards and significantly off-trend.
In our attempt to discern value in 2023, comparing current prices relative to long-term historical trends is a worthwhile exercise as it enables you to observe that current values, wherever they may lie, can have significant variations by asset class.
What is CPPI
CPPI stands for Commercial Property Price Index. Green Street’s Commercial Property Price Index®, which is released monthly, is a time series of unleveraged U.S. commercial property values that captures the prices at which commercial real estate transactions are currently being negotiated and contracted. We regularly pay attention to this metric to keep tabs on commercial real estate prices. For the purposes of this memo, we used major asset classes including, Apartment, Industrial, Office, Lodging, Strip Centers, which will be referred to as “All Property.” We refer to the following as subtypes for each of these asset classes.
- Multifamily: High-Rise, Mid-Rise, Garden and Subsidized
- Industrial: Bulk Distribution, Light Industrial, Flex/R&D, and Specialty
- Office: CBD, Flex, and Suburban
- Lodging: Luxury, Upper Upscale, Upscale, Upper Midscale, Midscale and Economy
- Strip Centers: Neighborhood, Community, and Power
- Lifestyle Center, Outlet, and Regional
While any data source is not necessarily perfect or reflective of reality, Green Street’s Commercial Property Price Index® (“CPPI”) offers a consistent analysis of U.S. CRE property values over an extended period of time. In essence, it typically provides the type of context and insights often necessary to help conduct a comparative analysis so that we can avoid painting with a broad brush.
When looking at the data, it appears that there are two distinct types of trends that have formed:
- Category 1 - "Standard": Historically, CRE appreciation slightly tends to outpace baseline inflation over the long run. Gleaning from CPPI data shared by Green Street, it appears that major asset classes appreciated roughly 4.8%* on an annual basis from 1997 to 2023 year-to-date (as of March 2023). If you observe this trend over the last decade from 2013 - 2023 year-to-date (as of March 2023), the percentage dips to 3.6%*. Let's call this "standard" appreciation.
*Green Street Commercial Property Price Index®, Data as of February, 2023. - Category 2 - "Anomalous": Asset classes that have deviated significantly from the Standard rate of appreciation need their own category because their trend lines are significantly at odds with the standard trendline. The reasons for such deviations are debatable, but for the sake of discussion, let's call these "Anomalous."
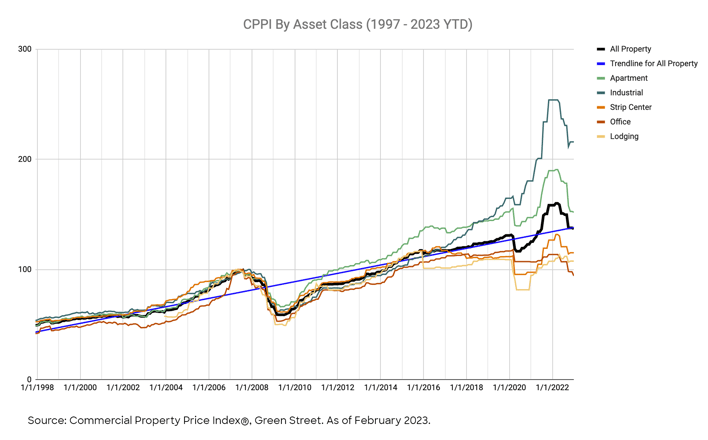
The chart above shows the price appreciation of all asset classes since 1997 until January 2023. When you observe the period from roughly 1997 to about 2015, asset prices, more or less, moved in correlation to each other. But it’s worth pausing to note that about eight years ago prices began to disperse for most asset classes, which is still baked into near-term future assumptions when underwriting deals. In other words, more price dispersion could be expected during the forthcoming cycle. The question remains: Will long-term future pricing trends continue to diverge or, perhaps, begin to converge again in the future? It seems implausible to me to suggest they will converge in the near-term, which is why I suggest analyzing individual asset classes along their own trends.
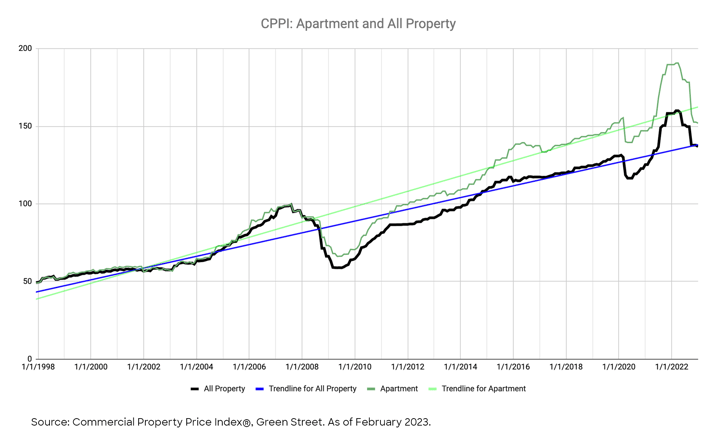
I’ll start with the apartment sector which, as you can see above, is currently priced at a discount to its own long-term trend (the price is below its trendline) but still resides at a premium to the “All Property” trend (the price is above the “All Property” trendline). Both of these positions relative to respective trends generally make sense to me, and here’s why.
As depicted in the chart, relative to the “All Property” trend, apartments broke out from the pack during the last cycle roughly by 2015. Having experienced this first hand in my career, my recollection as to why apartment prices broke out was primarily two-fold: 1) apartments tended to weather the Great Financial Crisis relatively better than* other major asset classes. For example, the performance of publicly traded REITS during the GFC for hospitality, retail, office, and industrial generally underperformed compared to self-storage, apartments, and healthcare* and 2) I observed that newer forms of construction (such as 5-over-1 podium construction) were typically delivering modern, amenitized buildings into urban submarkets. This helped draw increased interest to the sector from institutional owners, which Trepp refers to in “Multifamily: From a Second-Tier Asset Class to King of the Hill”. As a result, apartments grew in favor over the last cycle, which naturally led to price increases and cap rate compression.
*Source: Green Street, Heard on the Beach, “Same As It Ever Was”, 2019.
The way I see it, price correction in the multifamily sector over the last year at a macro level shows that apartment prices may present decent value relative to what we witnessed, on average, over the last eight years when prices began to deviate upward from the trend. Still, pricing alone fails to capture the entire picture for apartments going forward.
What is the concept behind a "Reversion to the Mean" scenario?
According to Investopedia, “Mean reversion, or reversion to the mean, is a theory used in finance that suggests that asset price volatility and historical returns eventually will revert to the long-run mean or average level of the entire dataset.” Read more here.
To fully discern value, I think you must factor in new supply because it has increased considerably as of late and it has been unevenly distributed depending on the market. Overall, the apartment sector still appears mildly undersupplied at the national level (estimates vary but Dr. Peter Linneman pegs it at roughly 462,000 units* undersupplied on a cumulative basis since 2002 through January 2023) but the risk of oversupply remains in certain markets. In addition, new construction has already begun to taper in some markets, so it seems that the supply and demand equation may tip towards excess demand again within a few years. But I do believe the next few years must be accounted for when considering pricing.
*Linneman Associates - The Linneman Letter, Winter 2022-23.
When acquiring apartments at a discount in oversupplied markets, which include some of the formerly high growth markets back in 2021, I think the amount of discount needs to offset the expectation of lackluster rent growth or higher-than-average vacancy outlooks, at least in the short-term. However, if assets are well-priced and situated in markets with above average demographic trends over the long run, I suspect they could offer entry points that could prove to be enviable in hindsight.
In addition to more general risks such as high vacancy rates, oversupply of product in the market, and credit quality of tenants, some of the factors that can impact the success or failure of multifamily investments include competition from single-family homes, fluctuations in the average occupancy rate, and increases in mortgage rates that can make debt financing more expensive.
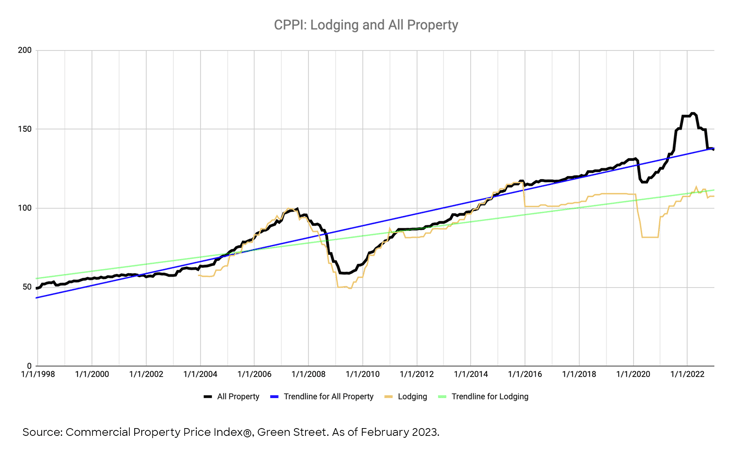
Next, let’s discuss hotels or “Lodging” as termed by Green Street. Considering the sector came to a near standstill in April of 2020 with Revenue per Available Room sinking to a low of $17.93, it is surprising that Green Street’s Lodging CPPI index only declined by 25%* that year. Similarly, CBRE'S Hotels report shows that hotel prices declined on average by approximately 20% in 2020 due to “COVID-19 value impairment”. I believe both underestimate the true hit to the industry during this period as market clearing values were obscured because a) transaction volume dropped significantly* that year and b) the operating volatility was so extreme that it became nearly impossible to value hotels in the short run.
*Standardized Downloads, Real Capital Analytics, as of March 1st, 2023.
As observable in the chart, the hotel sector is at a slight discount to its own trendline in 2023 and looks to be fairly valued in my opinion especially because hotel performance is typically back to pre-pandemic levels, at least on a nominal basis. Average daily rates have surpassed the pre-pandemic levels on a nominal basis and have recovered by 104%* since the pandemic - from $73.28 in April 2020 to $149.25 as of February 2023*. Occupancy levels have also trended upward, currently at roughly 59% as compared to 24.3% in April 2020. Although the hotel recovery was better than expected considering how devastated the sector was back in 2020, it has not yet fully recovered as Revenue Per Available Room or “RevPAR” is still slightly below pre-pandemic price levels on a real basis.
*CoStar Data, as of March 1st, 2023.
From my perspective, relative value for the hotel sector lies in leveraging the notion that it offers a ride in a time machine. You can potentially buy or recapitalize hotel assets today at 2020 prices, many of which would have likely appreciated were it not for the outlier effects of the pandemic that massively disrupted pricing from its standard trend. Therefore, I generally see value in higher-quality assets that are located in markets that appear to be better poised to thrive in the years ahead.
In addition to more general risks such as high vacancy rates, oversupply of product in the market, and credit quality of tenants, some of the factors that can impact the success or failure of hospitality investments include higher operating expenses or changes in travel patterns.
When speaking of sectors that were devastated during the pandemic, retail also fits this description, but to a lesser degree than hotels because essential retail still had a pulse even during lockdowns. “Strip Retail” as Green Street categorizes it, includes neighborhood, community, and power centers. This category is relatively close to the type of retail projects we typically seek out, with the exception of power centers. The chart below exemplifies my overall thesis on retail and, in particular, for grocery-anchored neighborhood centers. When you look at the chart, retail is still priced below its own trend and well below the standard “All Property” trend, yet I believe it is enviably positioned relative to most asset classes and here’s why I believe so. While demand is increasing for brick-and-mortar retail post-pandemic, new supply is still nearly non-existent, at roughly 0.5% of its total inventory*. Correspondingly, rents are on an upward trajectory.
*CoStar Data, as of March 1st, 2023.
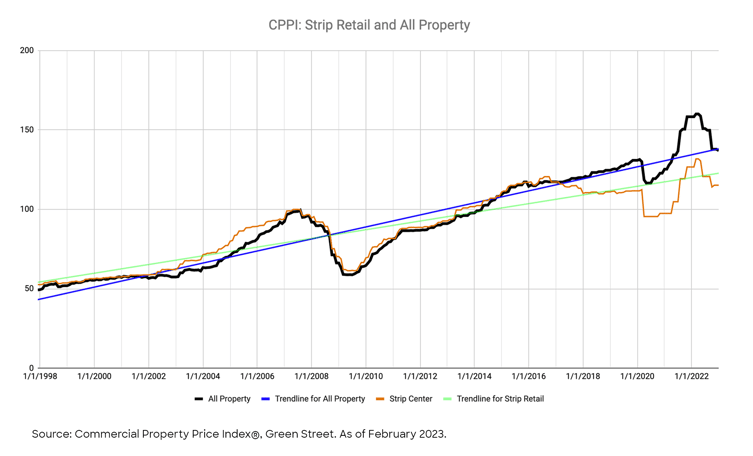
The way I see it, retail remains a relative value play because it still seems overlooked. Despite the fact that we were recently confronted with the reality of how essential retail is critical to our daily lives, the narrative that e-commerce will gobble up retail’s world still pervades the headlines. Perhaps it’s not as newsworthy but brick-and-mortar has quietly outpaced e-commerce over the past year in sales growth and it still accounts for over 85% of all retail sales as of the end of 2022. I believe that e-commerce will resume its upward trend and continue to increase its market share. My take is that its recent retrenchment appears to have simply restored its long-term trend. E-commerce has proven incapable of adequately addressing a number of consumer demands such as grocery shopping or services, yet the retail sector’s pricing does not seem to adequately reflect its continued relevance.
Given the adverse perception of retail, cap rates for this asset class may still offer the potential for positive leverage despite the fact that interest rates are historically high. I admit that the sector’s upside may be somewhat capped. Nonetheless, I admire retail’s ability to potentially produce what I consider to be attractive risk-adjusted returns. Retail also benefits from NNN leases which, by definition, means that operating expenses are reimbursed and thus not fully borne by the landlord in the same manner they are with other asset classes, such as apartments or certain office buildings, which can help mitigate the effects during an inflationary period.
In addition to more general risks such as high vacancy rates, oversupply of product in the market, and credit quality of tenants, some of the factors that can impact the success or failure of retail investments include the length of the lease(s) and whether it’s single or multi-tenant.
Having covered the “Standard” category, I’ll now move on to Category 2, the “Anomalous” trends for price appreciation. The way I see it, two sectors from our discussion have distanced themselves from the “All Property” trend in recent years - one to the downside and the other to the upside.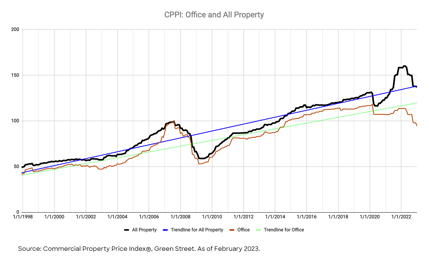
I’ll begin with the office sector, which I believe has broken out to the downside generally due to two reasons: 1) the emergence of the “work-from-home (WFH)” trend, and 2) the flight to quality trend rendering many office properties less desirable or functionally obsolete. From my vantage point, despite the current value of office assets sitting well below the “All Property trend”, the sector’s true value has yet to be priced into Green Street’s data as the WFH dust settles down. Similar to my perspective on the price of hotels back in 2020, as compared to historical levels, so few transactions have occurred in the office sector since the beginning of the pandemic that we may have yet to really experience the type of market clearing activity that will expose its true value. But, unlike the hotel sector where recovery is typically more reliant upon dynamic factors such as travel, leisure and staging events, the problems with the office sector are not always immediately remediable.
On the flight-to-quality trend, the relatively few trends that have occurred in the office sector over the past two years have been generally concentrated in newer and well-leased Class A buildings - such trades tend to skew aggregate values higher and mask the degree of underlying sector distress. However, I think that the "kicking the can down the road" strategy for the office owners may diminish this year, especially as more loans start to mature. Eventually, borrowers may be forced to capitulate. You can already observe a mounting number of office loan defaults with a simple Google search and I believe this trend may accelerate throughout 2023.
As the office sector continues to reprice this year (and possibly into next year), this somewhat broken sector, much like malls, has deviated far from the long-term pricing trends of other mainstream asset classes that the standard rules may no longer apply. But the fundamental difference I perceive between the office sector and Malls is that its “brokenness” may be relatively short-term in nature. In my opinion, an office building is still typically far more relevant to our daily lives than a regional mall is and I believe this may remain so in the future. To me, it’s more of a story of rebirth rather than pure real estate Darwinism.
The office sector undoubtedly needs to refashion itself and that may include acknowledging that much of its older, more commoditized stock is functionally obsolete. However, if the office sector continues to reprice at lower levels and it works through adapting to hybrid use demands then I believe the office sector could rejoin the “All Property” trend. Assuming that it remains well off the “All Property” Index for the next few years, once the office sector demonstrates signs of regaining its footing, it could be that point that I would view it as presenting a sector wide bargain. In the meantime, I view office as an asset class that typically mandates acquiring it at a low enough basis and/or with enough durable contractual income that you can remain patient and wait for that footing to appear, possibly later this decade.
In addition to more general risks such as high vacancy rates, oversupply of product in the market, and credit quality of tenants, some of the factors that can impact the success or failure of office investments include whether the property is single or multi-tenant and average length of the lease.
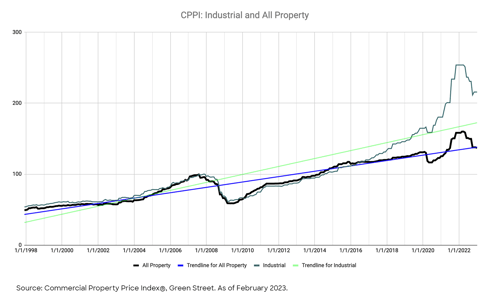
Next up in our “anomalous” category is the industrial sector. It’s not surprising that, out of all non-niche asset classes, the industrial sector has broken out on its own, higher, trajectory. Similar to apartments, the industrial sector also broke out in 2015 but it’s been on a higher trajectory ever since. So much so, that its trendline is the most dislocated one from the average property appreciation trend over the timeframe that we are observing (1997-2023 YTD). According to Green Street, “the past two years undoubtedly marked the best period in history for industrial real estate fundamentals, with national market rents growing over 40% cumulatively, exceeding that of the previous seven years combined.”* The reason behind the industrial sector’s departure from other primary asset classes is due in part to a step function like positive shift in perception that it experienced as the sector became inextricably linked to the growth of e-commerce. Thus, my underlying thesis for the industrial sector is that it became “special” during the last cycle in terms of its growth trajectory. Whether or not the industrial sector can maintain its anomalous growth trajectory for a decade or more is debatable but there is little evidence to suggest that it will abate in the near future.
The way I see it, the reversion towards trend that the industrial sector recorded in 2022 which is depicted on the graph above is almost entirely attributable to an expansion in cap rates. In essence, net operating incomes grew for the sector on the shoulders of strong rent growth while prices remained relatively flat. Since its outlook remains strong, I see the industrial sector as much closer to fair value in 2023, whereas I viewed it as generally overpriced at the beginning of 2022.
The question is: Is it now a bargain? It doesn’t seem like a bargain to me. With one of the strongest* mid-term outlooks according to Green Street*, the “defending champion*” is unlikely to go “on sale”. Also, worth noting is that with cap rates up over roughly 90 bps year-over-year (Jan 2022-Jan 2023)**, I believe there is potential that certain deals may pencil well enough that buying them, (such as lease up plays) rather than solely focusing on ground-up development may become a viable option. But, as the long-term industrial trend suggests, investing in the sector today, even at expanded cap rates, still may require you to subscribe to the thesis that it’s an anomalous asset class from a price appreciation standpoint that began to chart a new course in 2015.
*U.S. Industrial Outlook. Green Street, January 17, 2023.
**Cap Rate Observer, Green Street, 2023.
In addition to more general risks such as high vacancy rates, oversupply of product in the market, and credit quality of tenants, some of the factors that can impact the success or failure of industrial investments include declines in manufacturing activity due to reduced demand or trade agreements that outsource manufacturing efforts.
CLOSING THOUGHTS
A lot of factors can go into informing decisions in CRE investing. In this memo, my intention is to help provide a frame of reference when determining value between different asset classes.
Without a frame of reference, a deal may appear to look attractive relative to its previous peak when prices decline in the short-run. But there may be more to the equation. Today, a common question in my mind is, “does the current pricing for a prospective deal look attractive enough that investing in it can generate an appropriate risk-adjusted return, while assuming that the future value may be a reversion to the asset’s long-term trend, instead of an ascent to a new peak?” Essentially, when contemplating value relative to long-term historical trends, the key, in my opinion, is to use base case scenario assumptions that peg future values along, but not necessarily above the asset’s historical trendline. Future pricing scenarios that may climb above long-term historical trends are best categorized as upside scenarios.
Overall, thus far in 2023 I would say that we are generally beginning to see assets priced at levels that make sense in a “reversion to mean” scenario. However, as I discussed in my first memo, the current interest rate environment can materially complicate matters. Right now, not only should the asset look attractively priced relative to its long-term historical trend, but it also should be able to sustain the current cost of its debt. If it succeeds in that balancing act, then a comment shared by a leader in the multifamily industry at the 2023 National Multifamily Housing Council Annual Meeting could ring true - “Debt is temporary; basis is forever”.
Disclaimer: Investing in commercial real estate entails substantive risk. You should not invest unless you can sustain the risk of loss of capital, including the risk of total loss of capital. All investors should consider their individual factors in consultation with a professional advisor of their choosing when deciding if an investment is appropriate. Direct and indirect purchase of real property involves significant risks, including without limitation market risks, risks related to the sale of land and risks specific to a given property, which could include the potential for property value loss, potential for foreclosure, changes in tax status and fees, and costs and expenses associated with management of such properties. All investors should consider risks specific to that given property prior to investing. Private placements are illiquid investments and are intended for investors who do not need a liquid investment.
CrowdStreet, Inc. (“CrowdStreet”) offers investment opportunities and financial services on its website. Broker dealer services provided in connection with an investment are offered through CrowdStreet Capital LLC (“CrowdStreet Capital”), a broker dealer registered with FINRA and a member of SIPC.
This article was written by an employee(s) of CrowdStreet and the contents of this publication are for informational purposes only. Neither this publication nor the financial professionals who authored it are rendering financial, legal, tax or other professional advice or opinions on specific facts or matters, nor does the distribution of this publication to any person constitute an offer, recommendation, or solicitation to buy or sell any security or investment product issued by CrowdStreet or otherwise.
